

Global Stock Market Highlights
On Friday, U.S. markets closed higher. Investor optimism was driven by the Federal Reserve’s recent interest rate cut and strong corporate earnings, including FedEx’s better-than-expected profits.
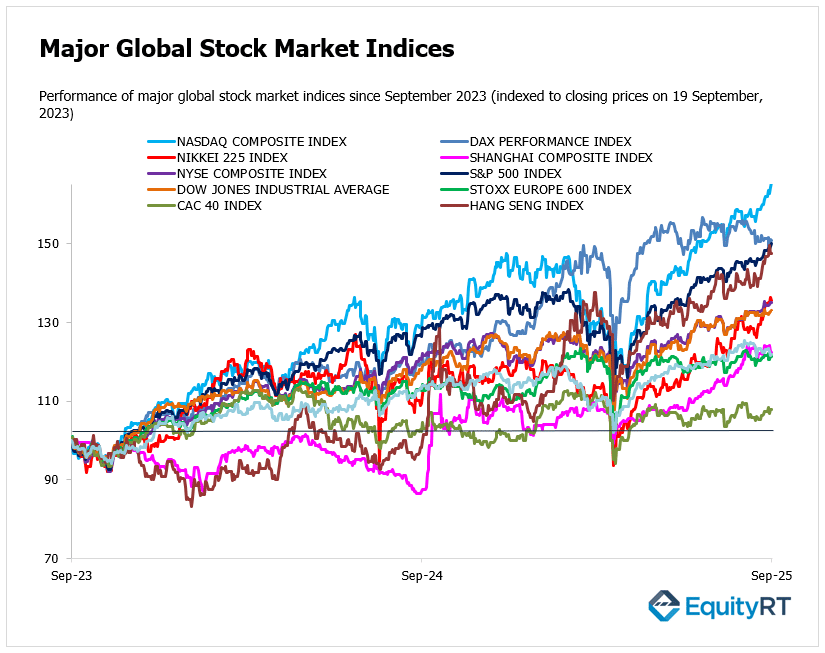
- Nasdaq Composite Index closed at 22,631.48, up 0.72% on the day, 2.21% higher for the week and 6.18% higher over the month.
- NYSE Composite Index closed at 21,493.97, down 0.05% on the day, 0.56% higher for the week and 3.23% higher over the month.
- S&P 500 Index closed at 6,664.36, up 0.49% on the day, 1.22% higher for the week and 3.95% higher over the month.
- Dow Jones Industrial Average EW closed at 14,314.37, up 0.17% on the day, 0.48% higher for the week and 1.45% higher over the month.
Markets were influenced by central bank decisions, including the Fed’s rate cut and Norway’s rate reduction, but concerns over European debt and U.S. tariffs kept gains limited.
- Stoxx Europe 600 Index closed at 554.12, down 0.16% on the day, 0.13% lower for the week and 0.66% lower over the month.
- DAX Performance Index closed at 23,639.41, down 0.15% on the day, 0.25% lower for the week and 3.21% lower over the month.
- CAC 40 Index closed at 7,853.59, down 0.01% on the day, 0.36% higher for the week and 1.57% lower over the month.
Across the Asia-Pacific region, markets showed mixed performance. Some indices retreated amid global uncertainties, while Australia saw modest gains.
- Nikkei 225 Index closed at 45,045.81, down 0.57% on the day, 0.62% higher for the week and 3.44% higher over the month.
- Hang Seng Index closed at 26,545.10, unchanged on the day, 0.59% higher for the week and 5.66% higher over the month.
- Shanghai Composite Index closed at 3,820.09, down 0.30% on the day, 1.30% lower for the week and 2.49% higher over the month.
- Australia S&P/ASX 200 Index closed at 8,773.50, up 0.32% on the day, 1.03% lower for the week and 1.38% lower over the month.

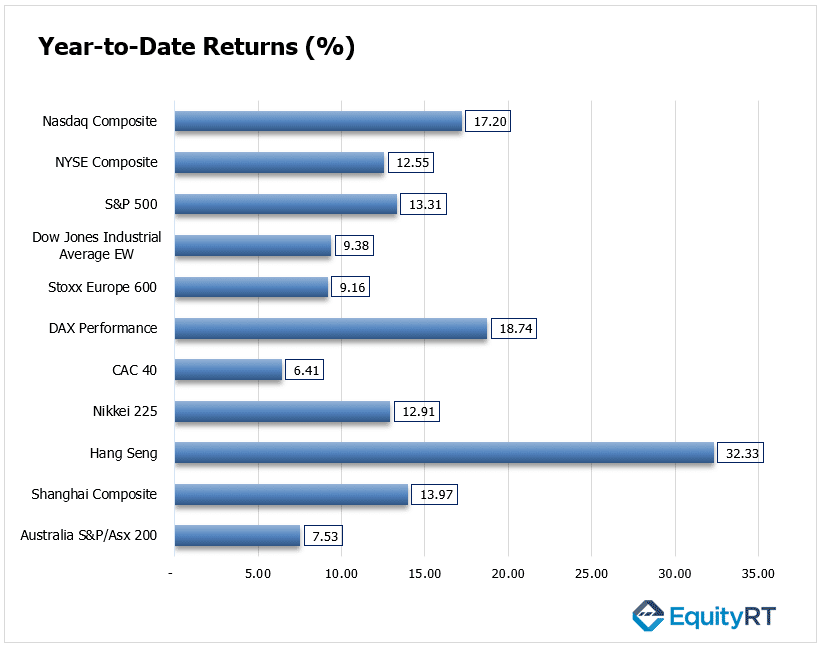
Stock Market Snapshot: Year-to-Date Performance Review
The standout performer is the Hang Seng Index, posting an impressive 32.33% year-to-date, far ahead of its global peers. This strong rebound highlights renewed optimism in Chinese equities and investor confidence in policy support.
The DAX Performance Index also shows notable strength with 18.74%, making it one of the top-performing developed market indices, supported by resilience in the German economy and industrials.
Among US benchmarks, the Nasdaq Composite (17.20%) leads, fueled by continued momentum in technology and growth stocks, while the S&P 500 (13.31%) and NYSE Composite (12.55%) also post solid double-digit gains. The Dow Jones EW (9.38%) trails slightly, reflecting its broader sector weighting.
In Asia, the Nikkei 225 (12.91%) remains firm, supported by a weaker yen and robust earnings, while the Shanghai Composite (13.97%) shows a healthy recovery.
On the weaker side, the CAC 40 (6.41%) and Australia’s S&P/ASX 200 (7.53%) lag, reflecting more subdued investor sentiment in those markets.
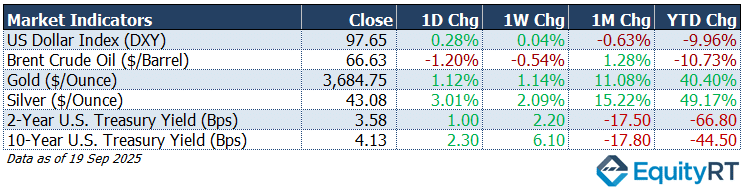
Market Snapshot: Dollar, Gold, Oil & U.S. Yields Update
- The US Dollar Index (DXY) closed at 97.65, up 0.28% on the day, 0.04% higher for the week, 0.63% lower for the month, and 9.96% lower year-to-date.
- Brent Crude Oil closed at $66.63 per barrel, down 1.20% on the day, 0.54% lower for the week, 1.28% higher over the month, and 10.73% lower year-to-date.
- Gold closed at $3,684.75 per ounce, up 1.12% on the day, 1.14% higher for the week, 11.08% higher over the month, and 40.40% higher year-to-date.
- Silver closed at $43.08 per ounce, up 3.01% on the day, 2.09% higher for the week, 15.22% higher over the month, and 49.17% higher year-to-date.
- The 2-Year U.S. Treasury Yield closed at 3.58%, up 1.00 bps on the day, 2.20 bps higher for the week, 17.50 bps lower over the month, and 66.80 bps lower year-to-date.
- The 10-Year U.S. Treasury Yield closed at 4.13%, up 2.30 bps on the day, 6.10 bps higher for the week, 17.80 bps lower over the month, and 44.50 bps lower year-to-date.
Take the Guesswork out of Investing: Backtest Your Strategies with Ease!
Key Economic Indicators to Watch This Week
Americas
In the US, markets will focus on speeches from several Fed officials, including Chair Powell at the Greater Providence Chamber of Commerce, for signals on the policy outlook. Key data releases include personal income and spending, with the Fed’s preferred inflation gauge, the PCE price index, alongside durable goods orders and S&P Global’s flash PMI.
Economists see August consumer spending rising 0.5% and income up 0.3% for a third straight month, while durable goods orders are expected to fall 0.4%, a smaller decline than in recent months.
The upcoming August 2025 PCE Price Index release on Friday will provide up-to-date information on inflation trends and may influence future monetary policy decisions.
Markets are looking for the August PCE inflation data to confirm a softening but still sticky trend. Consensus estimates point to a 0.2 percent increase in core PCE on the month, while the year-over-year rate is expected to edge up to around 2.8 percent.
Traders and analysts note that services inflation is likely to remain the main driver, while goods prices are expected to stay subdued.
This release is being closely watched because the Fed uses PCE as its preferred gauge of underlying inflation, and the outcome will shape expectations for the pace of rate cuts into year-end.

PMI readings are likely to highlight a slowdown in private-sector activity, and housing is set to remain weak, with existing and new home sales forecast at annualized rates of 3.98 million and 0.65 million.
Additional releases include final Q2 GDP, the current account, the Chicago Fed National Activity Index, advance goods trade balance, wholesale inventories, and the University of Michigan’s final sentiment survey.
Elsewhere, Mexico’s central bank will decide on interest rates, while Mexico’s trade balance, Canada’s monthly GDP, and Canadian producer prices will also be in focus.
Unleash Your Investment Potential. EquityRT might be the missing puzzle piece to reach your ultimate investment strategy.
Europe
In Europe, flash PMIs from the Eurozone, Germany, and France will be closely watched.
German factory activity may show early signs of stabilization after three years of contraction, while services are expected to shrink again at a slower pace.
Germany’s GfK consumer climate and Ifo business climate surveys are due, alongside broader sentiment indicators from the European Commission, France, and Italy.
Other notable releases include Eurozone car registrations, French unemployment, and Switzerland’s current account.
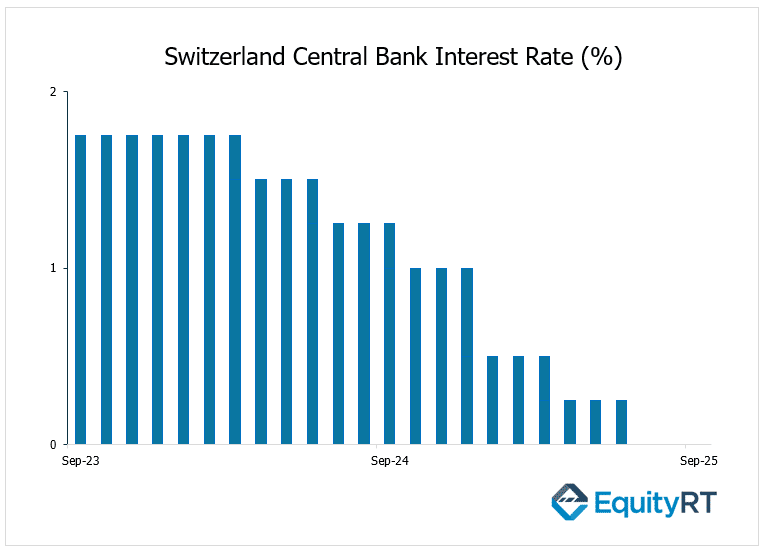
On the policy side, the Swiss National Bank and Sweden’s Riksbank are both expected to keep rates unchanged.
In the UK, flash PMIs and CBI surveys will dominate the calendar, pointing to a slight slowdown in services and continued weakness in manufacturing.
Take the Guesswork out of Investing: Backtest Your Strategies with Ease!
Asia-Pacific
The People’s Bank of China (PBOC) kept key lending rates at record lows for a fourth straight month in September, in line with market expectations.
China’s industrial profits, due for release on Saturday, are expected to show a 1.7% year-on-year decline. The drop highlights subdued business and consumer confidence that continues to weigh on demand and the broader economy.

In Japan, investors will watch September PMIs, Tokyo CPI, where core inflation is likely to accelerate to 2.8%, and minutes from the latest BoJ meeting.
India and Australia will both publish September PMI readings, with Australia also releasing its August monthly CPI. Inflation figures are also expected from Hong Kong, Malaysia, and Singapore, while Hong Kong and Thailand report trade data. In South Korea, producer prices, consumer sentiment, and business confidence are due.