
Basic Principles
When making an investment plan, we expect our savings to deliver a satisfactory yield without losing their purchasing power. Stock investment is no different. We must ensure a positive real return above inflation when we choose to buy a stock.
An investor must consider the market interest rates and the potential returns on alternatives while calculating the expected rate of return of his portfolios.(I assume that the market sets the right price without regulatory intervention).
Higher market interest rates and higher yields on alternative financial instruments naturally make us expect a higher return from our stock investments. Shifting the money to liquid funds and determinedly pursuing better investment opportunities should be the first step to take when we cannot find attractive stock ideas that will justify the opportunity cost.
Two Sides of Investing Psychology
Investors often oscillate between the two edges of a psychological situation that greatly influences the outcome;that is, enthusiasm at one edge and fear at the other. Keeping our emotions at bay is the key attitude of the stock investing strategy. It is because when share prices are down and pessimism abounds, a smart investment strategy requires avoiding herd mentality, not succumbing to emotions, and being disciplined and patient. At the time most investors are discouraged and fearfully selling the stocks they have been holding, the smart investor must have the courage to buy those stocks that are sold far below their values. Only in this way, we can buy top-quality stocks at attractive prices. Waiting for the optimism to boost in the market, will cause us to miss out on great investment opportunities.
.

When to Buy Large-Cap Stocks
The shares of large and popular companies are always highly demanded by investors hence their prices become higher than their intrinsic value, yet those shares can also be heavily penalized in adverse market conditions. To buy these stocks at attractive prices, either market players need to get scared in general or we must wait for the market to exaggerate a company-specific situation and over-punish it
All the information you need in one place. Add EquityRT to your toolkit for quality investment research.
Investing in Small-Cap Companies
Smaller companies are often overlooked when building up portfolios but they can punch above their weight. It is critical to remember that the continuous growth of big-cap companies gets tougher over time and higher capital returns invite competition and foster regulatory interference. Only the companies with strong competitive advantages (Buffett calls this “moat”) can enable large profits.
When to Buy Large-Cap Stocks
The shares of large and popular companies are always highly demanded by investors hence their prices become higher than their intrinsic value, yet those shares can also be heavily penalized in adverse market conditions. To buy these stocks at attractive prices, either market players need to get scared in general or we must wait for the market to exaggerate a company-specific situation and over-punish it.
Investing in Small-Cap Companies
Smaller companies are often overlooked when building up portfolios but they can punch above their weight. It is critical to remember that the continuous growth of big-cap companies gets tougher over time and higher capital returns invite competition and foster regulatory interference. Only the companies with strong competitive advantages (Buffett calls this “moat”) can enable large profits.

Is Revenue Growth Always a Good Indicator?
Even if we hold as little as one share, we become a company shareholder which grants us the right toclaim ourproportionate share inthe company’snet assets and earnings.
Management’sdecisions that may affect company earnings also have consequences on our earnings.Therefore, the future cash flow potential of the company is a vital indicatorforinvestors as a shareholder.
We should carefully consider whether a company’s revenue growth generates value or not. If the growth expectation is reflected in the prices excessively, it means that the risks are growing parallel. We should be investing in stock as if we are running the business. In other words, we need to realize that we are not lending the company money but buying a percentage of ownership.
Bottom Line
With this in mind, market volatility and short-term economic expectations will matter less to us andthe dynamics of the business and industry will become more vital indicators to monitor. Consequently, all we need to know is the total economic value of the company, that is, the faith of our investment.
About EquityRT
Portfolio managers, equity research analysts, economists, and many other investment professionals are constantly challenged to deliver quality research to guide the right investment decisions. Making the right decisions starts with having an optimum investment strategy in place.
Equityrt.com has compare stocks, stock screener, strategy builder and backtesting solutions that you may be interested in. In order to efficiently manage your portfolio,equityrt.com has a great portfolio management tool.
FAQ
1. How to evaluate stocks for investment?
Investors mostly use fundamental, technical, and quantitative analysis to evaluate the financial stability of a company.
Fundamental analysis focuses on a fair value for a company by evaluating the business in all aspects together with the sector and the market as a whole.
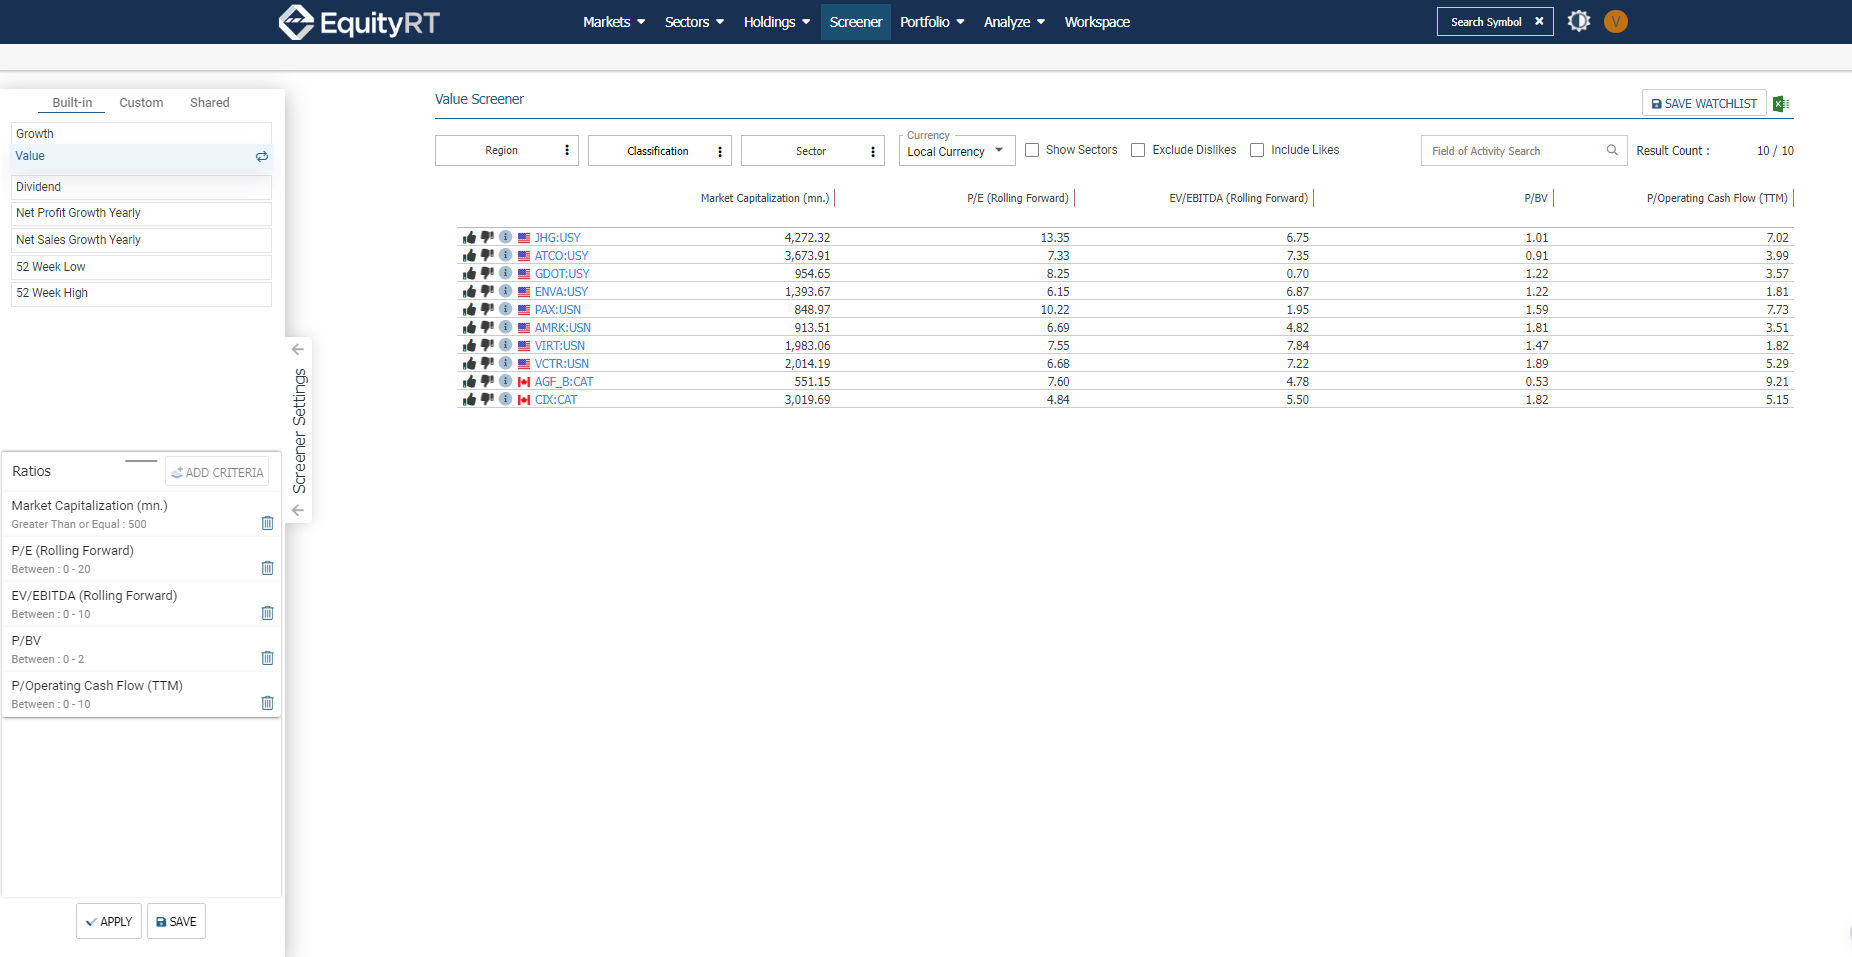
The goal of quantitative analysis is to use simple financial ratios to gain insight into the valuation of a specific company or broad market.
The technical analysis evaluates historical returns and changes in prices to be used to estimate future price movements
2. What are important investing metrics that may help investors make informed decisions?
There are tenths of company metrics to analyze, but first investors should understand the basics:
- Total Revenue
- Capital Expenditure
- Total Assets and Total Liabilities
- Cash and Cash Equivalents
- P/E Ratio
- P/B Ratio
- Debt-to-Equity Ratio
- Free Cash Flow
3. What are the three keys to investing?
- Define your saving goals and create your own investment plan
- Invest at the appropriate level of risk by finding the right mix of stocks and bonds
- Create your plan and manage your portfolio by researching, monitoring, and rebalancing.
4. What is the best way to analyse time series data?
Time series data is best analyzed using a charting application. A line graph is the simplest way to represent time series data as it helps the viewer get a quick sense of how something has changed over time. Multiple data sets can be overlayed to easily see similarities and identify differences in the data trends.
5. What is the best way to analyse time series data?
Time series data is best analyzed using a charting application. A line graph is the simplest way to represent time series data as it helps the viewer get a quick sense of how something has changed over time. Multiple data sets can be overlayed to easily see similarities and identify differences in the data trends.
6. What is the best way to analyse time series data?
Time series data is best analyzed using a charting application. A line graph is the simplest way to represent time series data as it helps the viewer get a quick sense of how something has changed over time. Multiple data sets can be overlayed to easily see similarities and identify differences in the data trends.
Disclaimer
Time series data is best analyzed using a charting application. A line graph is the simplest way to represent time series data as it helps the viewer get a quick sense of how something has changed over time. Multiple data sets can be overlayed to easily see similarities and identify differences in the data trends.