

Global Market Summary
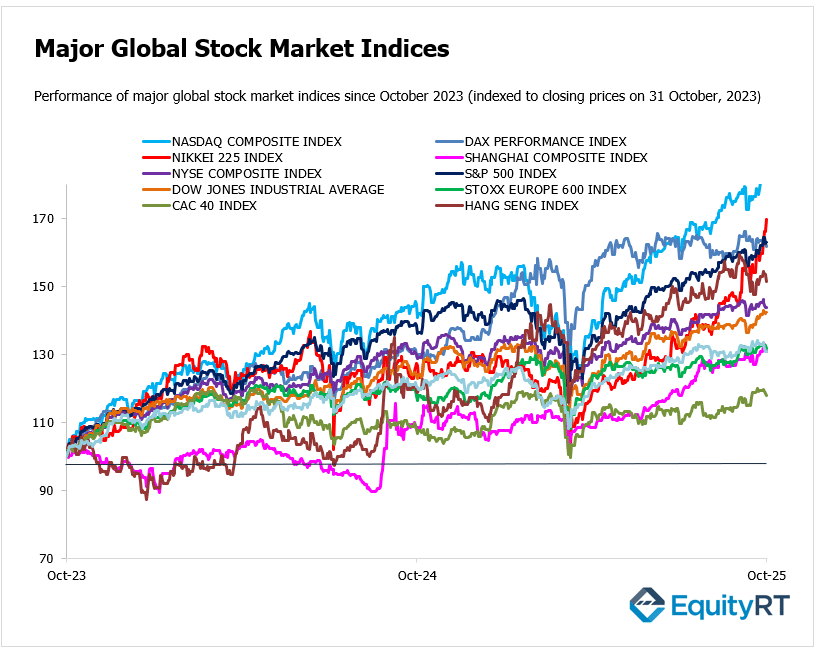
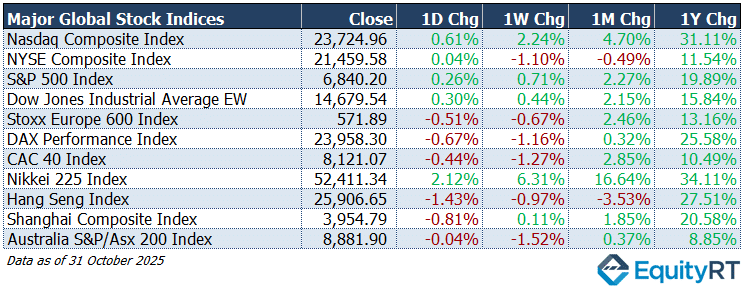
Global equities ended the week on a mixed note, Wall Street extended gains led by tech-heavy Nasdaq. European markets weakened amid profit-taking. Asian markets diverged, with Japan’s Nikkei hitting fresh highs and Hong Kong’s Hang Seng under pressure from renewed China growth concerns:
- Nasdaq Composite Index closed at 23,724.96, up 0.61% on the day, 2.24% higher for the week, 4.70% higher over the month, and 31.11% higher over the year.
- NYSE Composite Index closed at 21,459.58, up 0.04% on the day, 1.10% lower for the week, 0.49% lower over the month, and 11.54% higher over the year.
- S&P 500 Index closed at 6,840.20, up 0.26% on the day, 0.71% higher for the week, 2.27% higher over the month, and 19.89% higher over the year.
- Dow Jones Industrial Average EW closed at 14,679.54, up 0.30% on the day, 0.44% higher for the week, 2.15% higher over the month, and 15.84% higher over the year.
- Stoxx Europe 600 Index closed at 571.89, down 0.51% on the day, 0.67% lower for the week, 2.46% higher over the month, and 13.16% higher over the year.
- DAX Performance Index closed at 23,958.30, down 0.67% on the day, 1.16% lower for the week, 0.32% higher over the month, and 25.58% higher over the year.
- CAC 40 Index closed at 8,121.07, down 0.44% on the day, 1.27% lower for the week, 2.85% higher over the month, and 10.49% higher over the year.
- Nikkei 225 Index closed at 52,411.34, up 2.12% on the day, 6.31% higher for the week, 16.64% higher over the month, and 34.11% higher over the year.
- Hang Seng Index closed at 25,906.65, down 1.43% on the day, 0.97% lower for the week, 3.53% lower over the month, and 27.51% higher over the year.
- Shanghai Composite Index closed at 3,954.79, down 0.81% on the day, 0.11% higher for the week, 1.85% higher over the month, and 20.58% higher over the year.
- Australia S&P/ASX 200 Index closed at 8,881.90, down 0.04% on the day, 1.52% lower for the week, 0.37% higher over the month, and 8.85% higher over the year.
Global Stock Markets: Year-to-Date Performance Review
Global equities ended October on a strong note, with Asian indices leading gains. Japan’s Nikkei 225 topped the list with a 31.37% YTD gain, followed closely by Hong Kong’s Hang Seng (+29.15%) and Germany’s DAX (+20.34%).
In the US, the Nasdaq Composite advanced 22.86%, supported by continued strength in technology shares, while the S&P 500 gained 16.30% and the Dow Jones Industrial Average EW rose 12.17%.
Across Europe, the Stoxx Europe 600 climbed 12.66%, the CAC 40 added 10.03%, and Australia’s S&P/ASX 200 lagged with a modest 8.86% rise. China’s Shanghai Composite gained 17.99%, reflecting signs of policy support and improving investor sentiment.
Overall, tech-driven rallies and resilient earnings have supported global equity markets so far in 2025, though regional divergences remain amid uneven growth and monetary policy outlooks.

Market Snapshot: Dollar, Gold, Oil & U.S. Yields Update
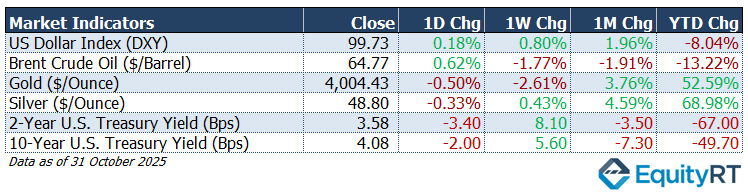
The week closed with the dollar edging higher and commodities mixed, oil slipped further on demand worries, while precious metals eased after strong year-to-date rallies.
Treasury yields fluctuated but stayed well below early-year highs, reflecting expectations of a more dovish monetary outlook heading into year-end.
- US Dollar Index (DXY) closed at 99.73, up 0.18% on the day, 0.80% higher for the week, 1.96% higher over the month, but still 8.04% lower year-to-date, showing mild recovery momentum after extended weakness.
- Brent Crude Oil settled at $64.77 per barrel, rising 0.62% on the day but falling 1.77% over the week, 1.91% over the month, and 13.22% since the start of the year, as oversupply and slowing demand continue to weigh on prices.
- Gold closed at $4,004.43 per ounce, down 0.50% on the day and 2.61% over the week, though still 3.76% higher for the month and up an impressive 52.59% year-to-date, reflecting persistent safe-haven demand.
- Silver ended at $48.80 per ounce, slipping 0.33% on the day but posting a 0.43% weekly gain, 4.59% monthly rise, and a strong 68.98% year-to-date advance.
- The 2-Year U.S. Treasury Yield stood at 3.58 bps, down 3.40 on the day but 8.10 higher over the week, 3.50 lower for the month, and 67.00 bps lower year-to-date, reflecting shifting short-term rate expectations.
- The 10-Year U.S. Treasury Yield ended at 4.08 bps, down 2.00 on the day, 5.60 higher over the week, 7.30 lower for the month, and 49.70 bps lower year-to-date, showing long-term yields remain subdued amid easing inflation
Take the Guesswork out of Investing: Backtest Your Strategies with Ease!
Weekly Macro Highlights
OPEC+ Agrees on Modest Output Increase for December
At its November meeting, the OPEC+ group agreed to increase daily oil production by 137,000 barrels starting in December. The group also announced that additional production hikes will be paused in January, February, and March, citing seasonal factors and the typically weaker demand seen in the first quarter as the main reasons for this decision.
U.S. Focus: Data Delays and Labor Market Watch
In the US, the government shutdown shows no signs of resolution and is likely to extend into a second month, delaying the release of key economic data. Still, investors will turn their attention to upcoming reports, including ADP employment, ISM manufacturing and services PMIs, and the University of Michigan Consumer Sentiment Index.
Private-sector employment is expected to rise 25K in October, following a 32K drop in September, the sharpest decline since March 2023. ISM surveys are likely to show continued weakness in manufacturing but a rebound in services activity. Other releases include Challenger job cuts, final S&P Global PMIs, consumer credit, and inflation expectations.
The earnings season continues with results due from Palantir Technologies, Berkshire Hathaway, Realty Income, Vertex Pharmaceuticals, AMD, Uber, Amgen, Pfizer, McDonald’s, Qualcomm, and ConocoPhillips.
Traders will also watch for remarks from Fed officials and the Treasury’s quarterly refunding announcement.
Central Bank Decisions Across the Americas
Monetary policy takes center stage as Mexico and Brazil prepare for rate announcements, with both expected to balance growth concerns against sticky inflation.
Elsewhere, Canada will release employment and PMI data, while Mexico reports inflation and sentiment indexes and Brazil publish industrial output and trade figures, offering further insight into regional economic momentum.
Unleash Your Investment Potential. EquityRT might be the missing puzzle piece to reach your ultimate investment strategy.
Inflation Cooling, Growth Concerns Rising in Europe
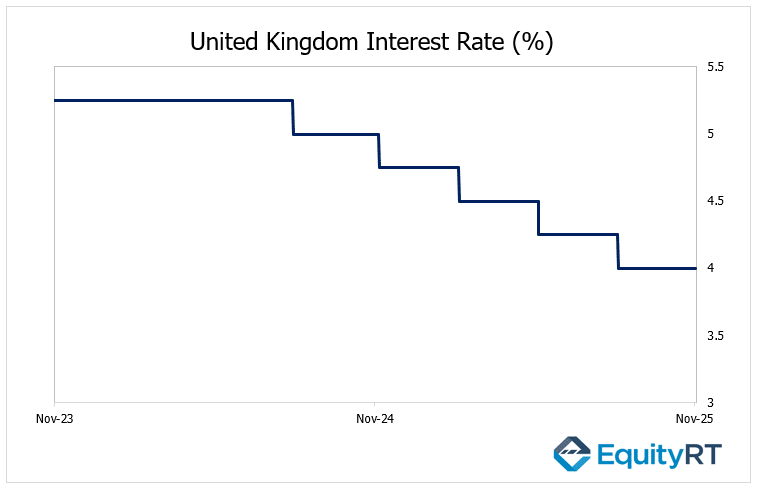
The Bank of England is widely expected to hold rates steady, but softer growth and easing price pressures have markets eyeing a possible rate cut later this year.
Final PMI data for the Eurozone, Germany, and France, along with factory orders and trade figures, will shed light on manufacturing momentum.
Eurozone Manufacturing PMI rose slightly to 50 in October from 49.8 in September, signaling a return to expansion. Germany’s PMI was confirmed at 49.6, while France’s improved to 48.8, indicating a slower pace of contraction.
France and Italy will also release industrial production and retail sales data, and Swiss inflation eased to a four-month low.
Decisions from Sweden’s Riksbank, Poland’s NBP, and Norway’s Norges Bank are also due, with no policy changes anticipated.
Take the Guesswork out of Investing: Backtest Your Strategies with Ease!
Asia-Pacific Outlook: Trade, Inflation, and Growth Signals
China’s October trade surplus is projected to hover near $100 billion, with markets expecting a moderation in export growth after September’s strong rebound. Exports are likely to rise at a slower pace amid softer global demand, while imports could edge higher on commodity purchases. However, lingering weakness in domestic consumption and property activity is expected to limit gains. The data will be released this Friday.

The Caixin PMIs will reveal whether the slowdown in manufacturing deepens.
In Japan, investors will monitor wage growth, household spending, and sentiment indexes, along with Bank of Japan meeting minutes for policy clues.
The Reserve Bank of Australia is expected to hold its rate at 3.6%, while key data, including trade balance, housing, and consumption figures, will provide insight into domestic resilience.
Elsewhere, Indonesia, Vietnam, and Taiwan report trade data, and several Asian economies, including South Korea, Thailand, and the Philippines, will release inflation updates.
Markets will also watch New Zealand’s labor report and GDP data from Indonesia and the Philippines, alongside Malaysia’s policy decision and regional PMI releases.