info@equityrt.com
  • 
  • 
  • 
  • 
  • 
  • U.S.
  • EUROPE
  • AFRICA
  • ASIA
  • PACIFIC
EquityRT
    • About Us
      • Who Do We Help
        • Global Footprint
          • In The News
            • Blog
            • Press
          • Stock Market Data Analysis
            • Strategy Building & Backtesting
            • Portfolio Management
            • Financial Charting
            • Stock Screener
            • Sector Analytics
            • Stock Holder Analysis
            • Excel for Financial Analysis
          • Specialized Data Solutions
            • Automated Data Delivery
          • Industries
            • Investment Management
            • Financial Advisory and Wealth Management
            • Economic Research and Academia
            • Investor Relations and Corporates
            • Consulting and Advisory Services
          • Global Support
            • support@equityrt.com
          • General Enquiries
            • info@equityrt.com
          • Knowledge Hub
            • Financial Glossary
            • Market Research
            • Equity Research
            • Economic Research
            • Analytical Tools
        • Plans
        • Login
        • Get Started
          • About Us
          • Who Do We Help
          • Global Footprint
            • Blog
            • Press
            • Strategy Building & Backtesting
            • Portfolio Management
            • Financial Charting
            • Stock Screener
            • Sector Analytics
            • Stock Holder Analysis
            • Excel for Financial Analysis
            • Automated Data Delivery
            • Investment Management
            • Financial Advisory and Wealth Management
            • Economic Research and Academia
            • Investor Relations and Corporates
            • Consulting and Advisory Services
            • support@equityrt.com
            • info@equityrt.com
            • Financial Glossary
            • Market Research
            • Equity Research
            • Economic Research
            • Analytical Tools
        • Plans
        • Login
        • Get Started

        The Rise in Commodity Prices A new commodity supercycle?

        Ozge Gurses
        | Jul 12, 2021

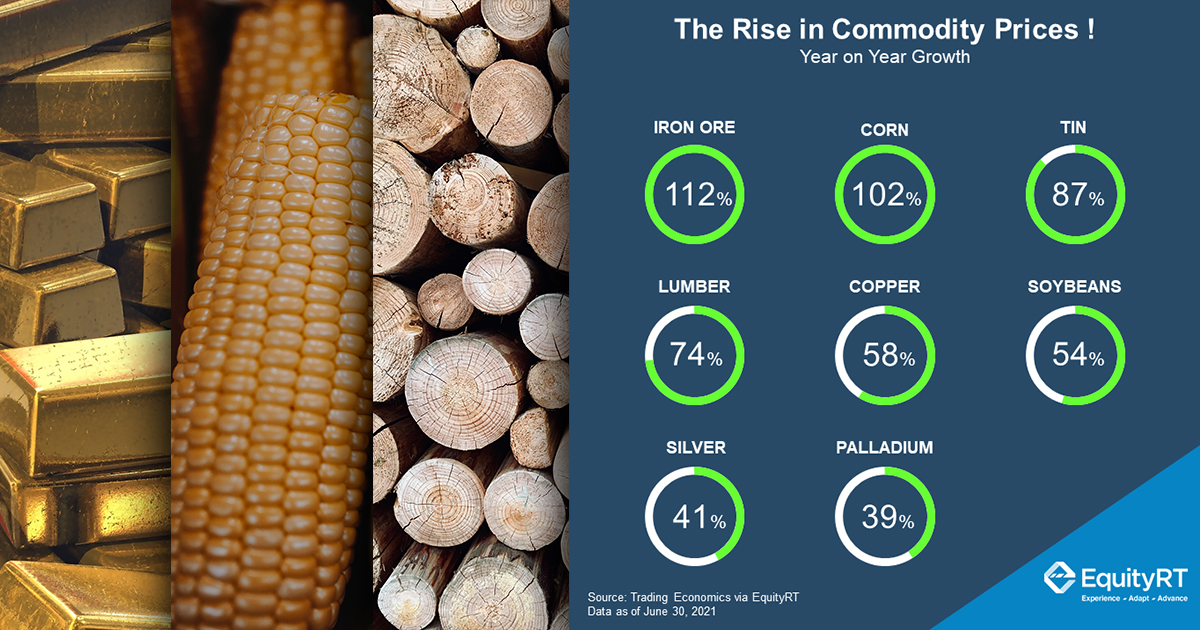
        Commodity prices reached very high levels this year. A rebound in the world’s largest economies was driving demand for food, energy, and metals. The massive amount of liquidity injections along with the loose monetary stance and vaccine-driven optimism certainly supported the commodities demand.

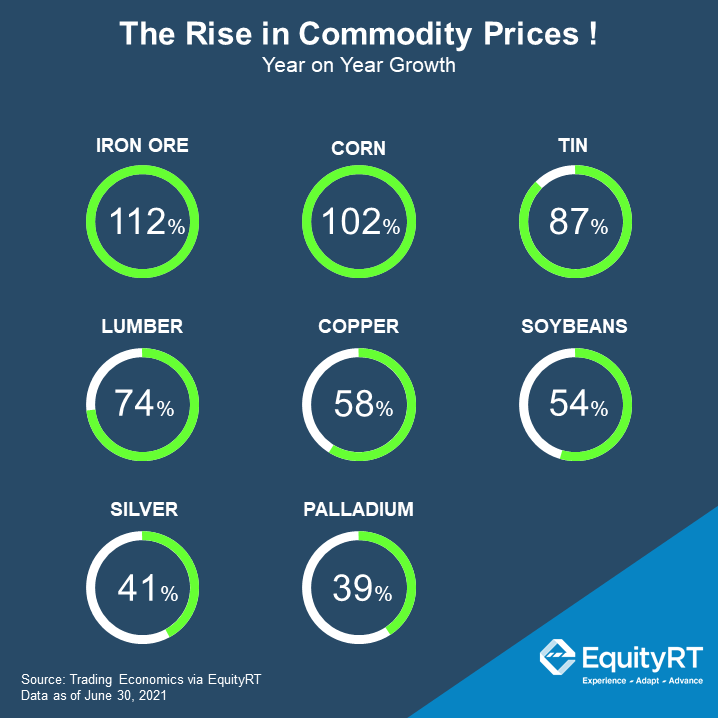
        From corn to iron ore and lumber, commodities across metals, energy, and agriculture sectors increased sharply. 


        All the information you need in one place. Add EquityRT to your toolkit for quality investment research.
        Request a trial
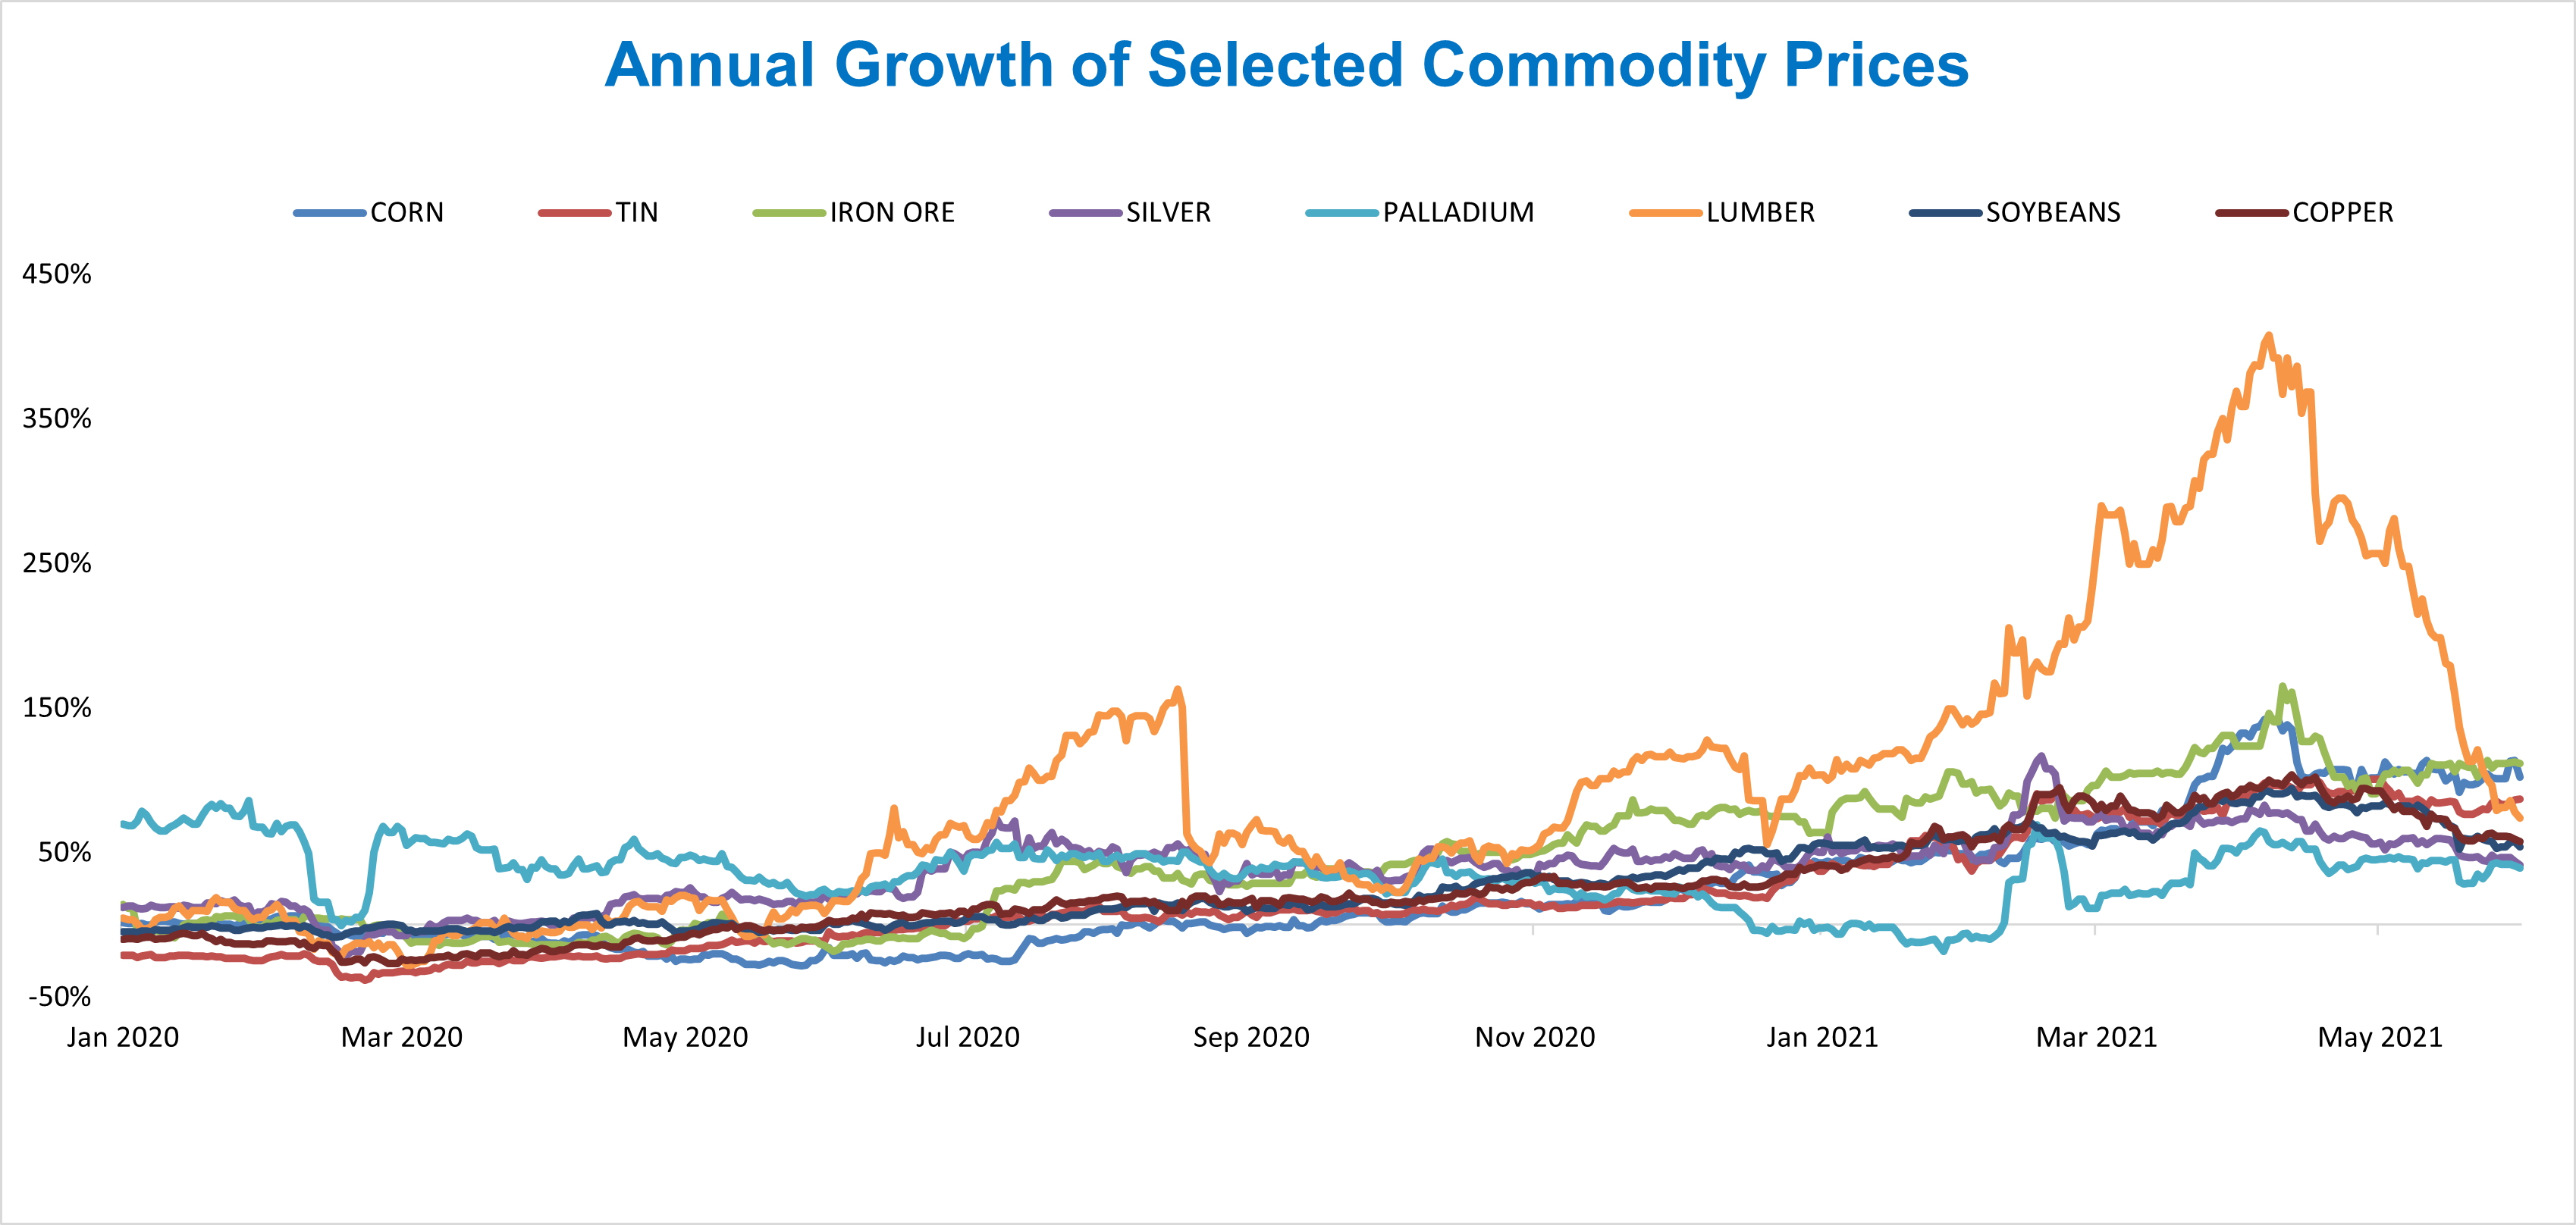
        Annual Growth of Selected Commodities
        Brazil

        The commodity prices tend to be the most volatile when compared to other prices in the economy because in the short term, supply and demand are relatively price inelastic. It takes time to increase commodity production.
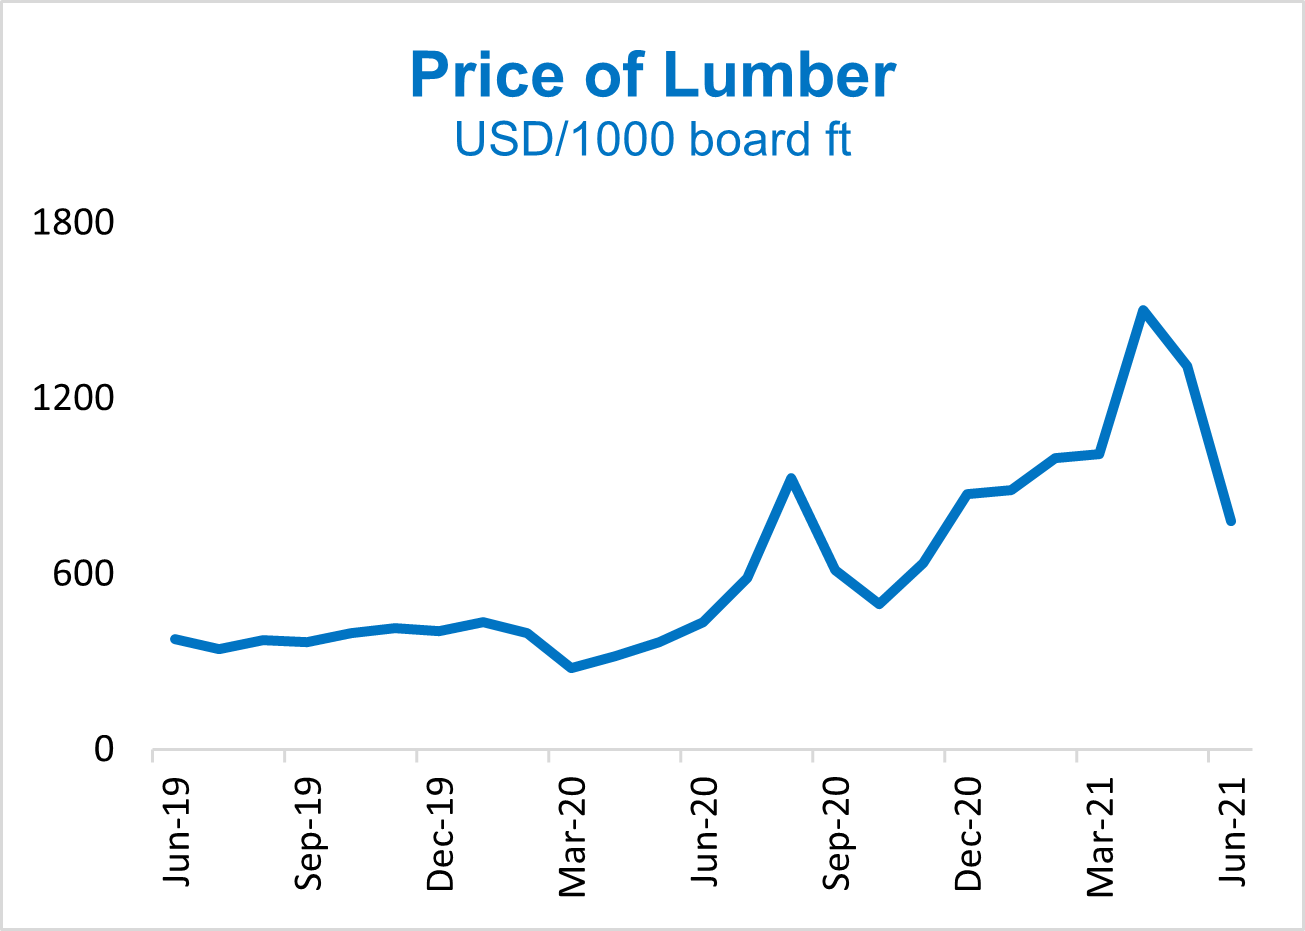
        Price of Lumber

        Among agricultural commodities, lumber prices soared over a year time and reached hyper highs as of 07 May 2021, increasing more than 400% compared to last year.

        Lumber is the main material used to build most homes. According to estimates from the U.S. National Association of Home Builders (NAHB), construction on a new home has reached an average of about $36,000 dollars more than last year just because of lumber costs. 

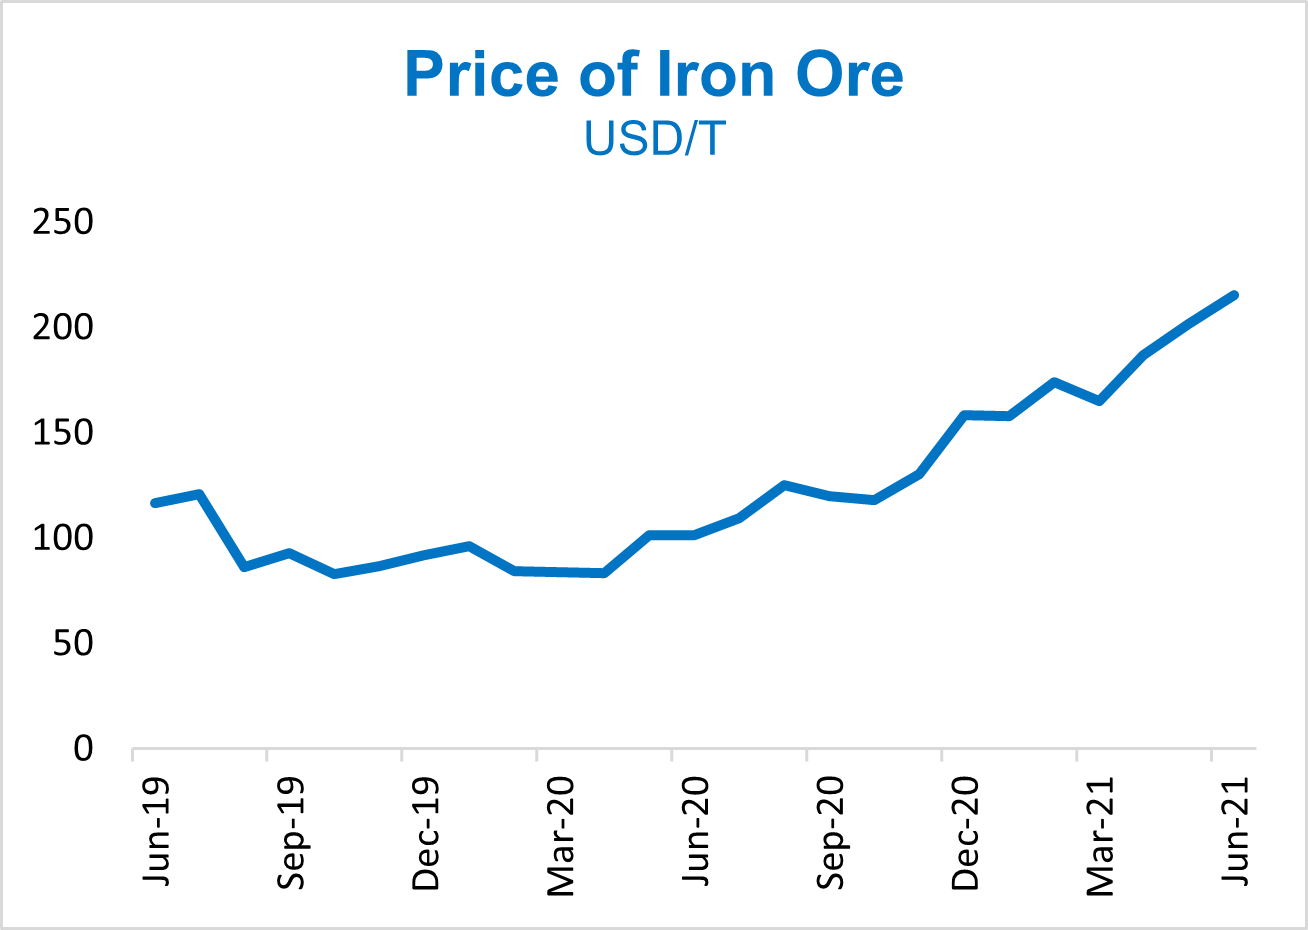
        Iron ore stands out as the best performer among industrial commodities as a result strong demand from the Chinese steel industry and supply restrictions during the pandemic recovery period.

        The primary use of iron ore is to make steel for infrastructure and other construction projects. 
        Central Bank Rate Brazil
        Price of Lumber

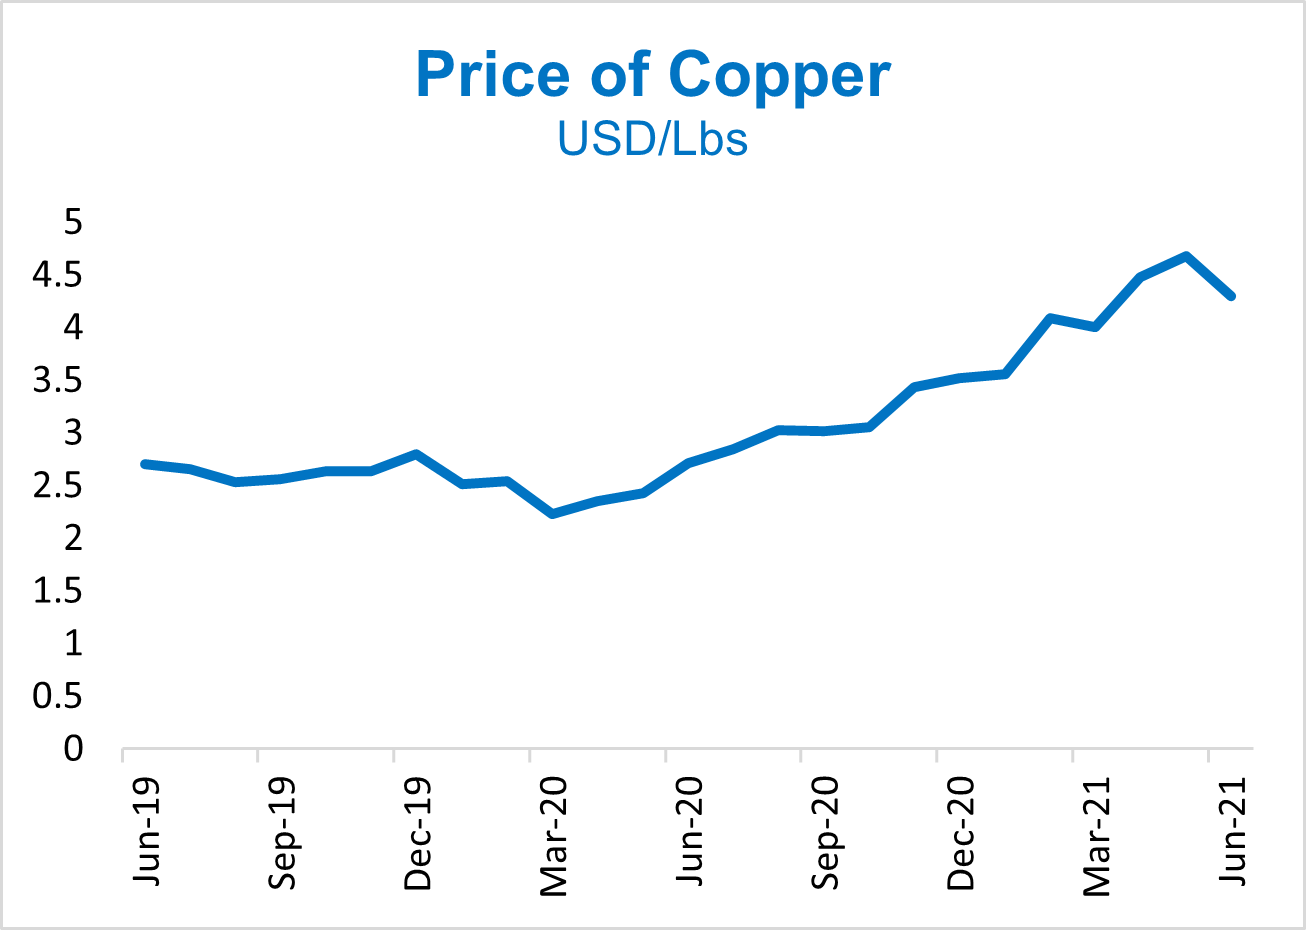
        Copper‘s story is also similar to that of iron ore, where opening economies have been fueling demand for red metal by its major role in rapidly growing industrial sectors.

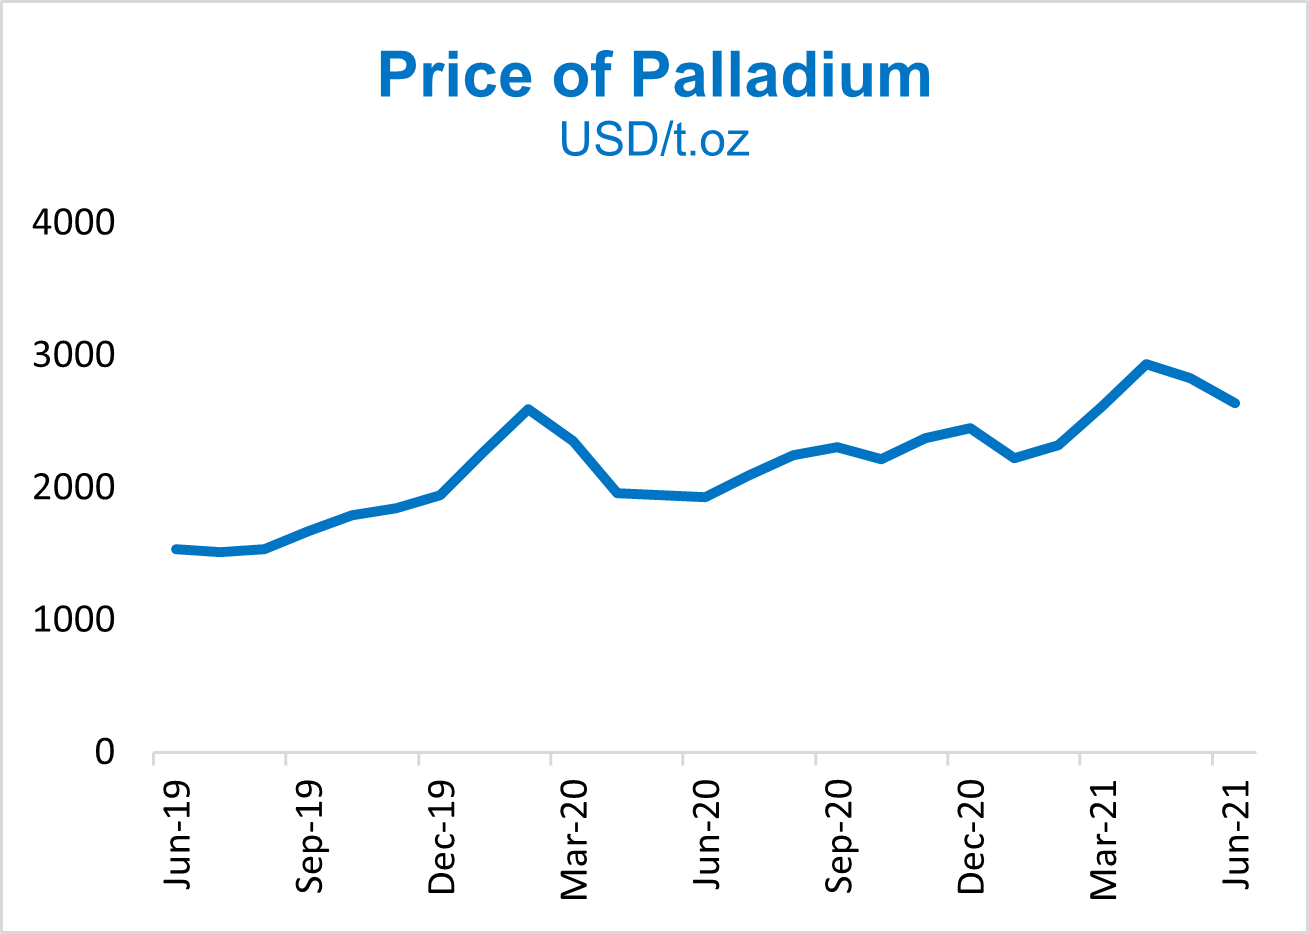
        Tighter environmental standards imposed by many countries were pushing up automakers’ demand for palladium as this precious metal is a key input for catalytic converters which converts toxic substances into less harmful gases.
        Central Bank Rate Brazil

        It is difficult to predict whether higher prices will ease or not. So, are we at the start of a new commodity supercycle or is this just a cyclical upswing triggered by the massive stimulus response to the pandemic?

        A supercycle is defined as a period where prices rise above their long-term trends.

        Rapid industrialization drives commodities into cycles where the squeezed supply takes prices above long-term trend lines and prices can not calm until growth slows down. A supercycle can last for decades.

        History shows that supercycles are usually demand-driven and we would need to witness strong and sustainable demand growth in the years ahead.

        Source: Trading Economics via EquityRT MacroAnalytics

        Report by Özge Gürses | Macro Research at EquityRT

        2021-07-12

        Daily historical, current and estimated quarterly prices of key industrial commodities from metals to food products are available via EquityRT.​
        Contact us to get started with your free-trial of EquityRT MacroAnalytics.

        Disclaimer: The information in the publication is not an investment recommendation and it is not an investment or an offer or solicitation to purchase or sell any financial instrument. Reasonable care has been taken to ensure that this publication is not untrue or misleading when published, but EquityRT does not represent that it is accurate or complete. EquityRT does not accept any liability for any direct, indirect, or consequential loss arising from any use of this publication. Unless otherwise stated, any views, forecasts, or estimates are solely those of the author, as of the date of the publication and are subject to change without notice.

        Experience EquityRT

        Try Now

        Key Feature

        Build and backtest a fundamental-based investment strategy

        Intuitive tools to analyse industry sectors and compare peers.

        Create analytical visualizations with advanced charting.

        How can we help you?

        REQUEST DEMO
        REQUEST FREE TRIAL
        About
        Features
        Plans
        Blog
        Support
        Sign in
        Free Trial

        Compare Stocks
        Stock Screener
        Portfolio Management
        Excel for Financial Analysis

        Financial Modeling
        Financial Charts
        Stock Holdings Tracker
        Stock Dashboard

        Contact Us

        Connect with us

        • Follow
        • Follow
        • Follow
        • Follow
        • Follow

        Terms of Service | Privacy Policy | Disclaimer

        © EquityRT 2021. All rights reserved.