

Global Stock Market Highlights
US stocks mostly climbed on Friday after job market data met expectations, boosting confidence in the economy’s health. The positive report reassured investors that the labor market remains strong enough to support economic growth without sparking immediate inflation worries.
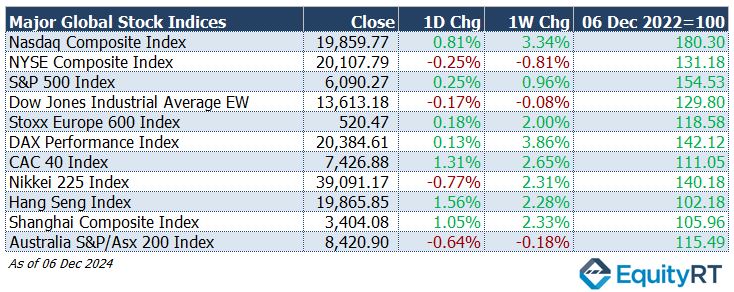
- Nasdaq Composite Index rose to 19,859.77, gaining 0.81% for the day and 3.34% for the week.
- NYSE Composite Index declined to 20,107.79, losing 0.25% for the day and 0.81% for the week.
- S&P 500 Index edged up to 6,090.27, rising 0.25% for the day and 0.96% for the week.
- Dow Jones Industrial Average EW dropped to 13,613.18, decreasing 0.17% for the day and 0.08% for the week.
European markets edged up slightly on Friday as investors tracked recent political events in France.
- Stoxx Europe 600 Index increased to 520.47, adding 0.18% for the day and 2.00% for the week.
- DAX Performance Index rose to 20,384.61, advancing 0.13% for the day and 3.86% for the week.
- CAC-40 Index climbed to 7,426.88, surging 1.31% for the day and 2.65% for the week.
Asian markets showed mixed results, with traders closely watching the political situation in South Korea following President Yoon Suk Yeol’s temporary declaration of martial law.
- Shanghai Composite Index advanced to 3,404.08, gaining 1.05% for the day and 2.33% for the week.
- Hang Seng Index fell to 39,091.17, dropping 0.77% for the day but gaining 2.31% for the week.
- Nikkei 225 Index fell to 38,208.03, dropping 0.37% for the day and 0.20% for the week.
- Australia’s S&P/ASX 200 Index declined to 8,420.90, losing 0.64% for the day and 0.18% for the week.

- The Dollar Index (DXY), a closely watched gauge of the U.S. dollar’s performance against other major currencies, rose to 105.99, gaining 0.25% on the day and 0.20% over the week, reflecting continued demand for the dollar.
- The Brent crude oil the global oil price benchmark, fell to $71.12 per barrel, losing 1.35% for the day and 1.74% for the week as market sentiment shifted amid concerns over global demand.
- The Gold settled at $2,633.30 per ounce, with a slight daily dip of 0.02% and a weekly loss of 0.92%, as investors balanced inflation expectations and interest rate outlooks.
- The 2-year U.S. Treasury yield particularly responsive to Federal Reserve policy rates, dropped to 4.11%, declining by 3.80 basis points on the day and 4.70 basis points over the week, signalling increased demand for short-term bonds.
- The 10-year U.S. Treasury yield an indicator of long-term borrowing costs, edged down to 4.17%, falling by 0.50 basis points both daily and weekly, indicating steady investor interest in long-term bonds.

Take the Guesswork out of Investing: Backtest Your Strategies with Ease!
Upcoming U.S. Economic Indicators to Watch This Week
This week, key attention in the United States will be focused on inflation indicators, including the Consumer Price Index (CPI), Producer Price Index (PPI), and data on export and import prices.
On Wednesday, the upcoming U.S. Consumer Price Index (CPI) report is expected to attract significant attention, with annual inflation projected to rise to 2.7% in November, marking the highest rate in four months, up from 2.6% in October.
Monthly inflation is anticipated to remain steady at 0.2%, while core inflation is expected to hold steady at 3.3% year-on-year and 0.3% month-on-month.
Similarly, on Thursday, producer price inflation (PPI) is forecasted to increase slightly, with the annual rate rising to 2.5% from 2.4%, while the monthly increase is projected to reach 0.3%, up from 0.2%.
Core PPI is expected to rise to 3.3% annually, while the monthly figure should remain at 0.3%.

U.S. initial jobless claims increased to 224,000 for the week ending November 30, up from 213,000 the previous week and higher than the expected 215,000. While this marks the highest level in six weeks, it still indicates that the U.S. labor market remains strong, despite the Federal Reserve’s recent tightening measures.
The four-week moving average also rose slightly to 218,250, reflecting a small increase in claims. The data continues to suggest that the labor market’s strength provides the Fed with some flexibility in its monetary policy, particularly if inflation persists.

Other key economic releases include data on wholesale inventories, consumer inflation expectations, the NFIB Business Optimism Index, nonfarm productivity, labor costs, and export and import prices.
In Canada, expectations are that the Bank of Canada will continue its monetary easing path with a 50-basis point rate cut, marking the second consecutive reduction.
In contrast, Brazil’s central bank is likely to raise interest rates by 75 basis points due to rising inflation pressures.
Unleash Your Investment Potential. EquityRT might be the missing puzzle piece to reach your ultimate investment strategy.
European Economic Trends: This Week’s Macro Insights
The European Central Bank (ECB) is set to meet this Thursday for its final decision of 2024, with most economists predicting a 25-basis-point rate cut, marking the fourth reduction of the year.
The ECB implemented its third rate cut of the year at its October meeting, lowering rates by 25 basis points, in line with expectations, following similar reductions in June and September.
Similarly, the Swiss National Bank (SNB) is expected to lower its policy rate by 25 basis points to 0.75%, continuing its series of rate cuts. In September 2024, the SNB had already reduced its key policy rate by 25 basis points to 1%, marking the third consecutive cut and bringing borrowing costs to their lowest level since early 2023.

On the macroeconomic front, industrial production in the Euro Area is forecast to show a recovery for October. Industrial production in the Euro Area fell by 2% in September 2024 compared to the previous month. When compared to September 2023, the decline was steeper, at 2.8% year-on-year.
On Tuesday, Germany’s final November inflation data will provide key insights for the ECB’s monetary policy. Early figures showed headline inflation falling 0.2% monthly but rising to 2.2% annually, above the ECB’s 2% target. Core inflation also edged up to 3% annually, its highest level in six months.
In Germany, exports are projected to decline more sharply than imports during the same month.
The UK will release important economic data, including monthly GDP, industrial production, and trade balance figures.
Take the Guesswork out of Investing: Backtest Your Strategies with Ease!
Asian Economic Data: This Week’s Outlook
China’s November CPI and PPI data showed a mixed picture.
Headline CPI fell 0.6% month-on-month, exceeding expectations of a 0.4% drop, while annual inflation slowed to 0.2% from 0.3%, maintaining its subdued trend. Core CPI rose slightly to 0.3% year-on-year, its highest in three months.

PPI recorded a modest 0.1% monthly increase, its first rise in six months, though the annual decline narrowed to 2.5% from 2.9%, signaling persistent deflationary pressures despite recent policy support.
In Japan, Q3 GDP growth was revised upward, with quarterly growth adjusted from 0.2% to 0.3% and annual growth revised from 0.9% to 1.2%. This improvement came from stronger capital investments and exports, partially offsetting weaker consumption spending.
In Japan, attention will be on machine tool orders, producer prices, and industrial production data.
In Australia, the Reserve Bank of Australia (RBA) is expected to keep the key interest rate unchanged at 4.35%, allowing the central bank more time to assess whether the recent slowdown in inflation is sustainable.
On the data front, the unemployment rate is expected to rise by 20,000, pushing the unemployment rate up to 4.2%.